Generating Reports with Charts in Podio
Search the Labs

Get Email into Podio
Want to get your email conversations into Podio? Check out GlobiMail for Podio
Posted: 2015-10-10
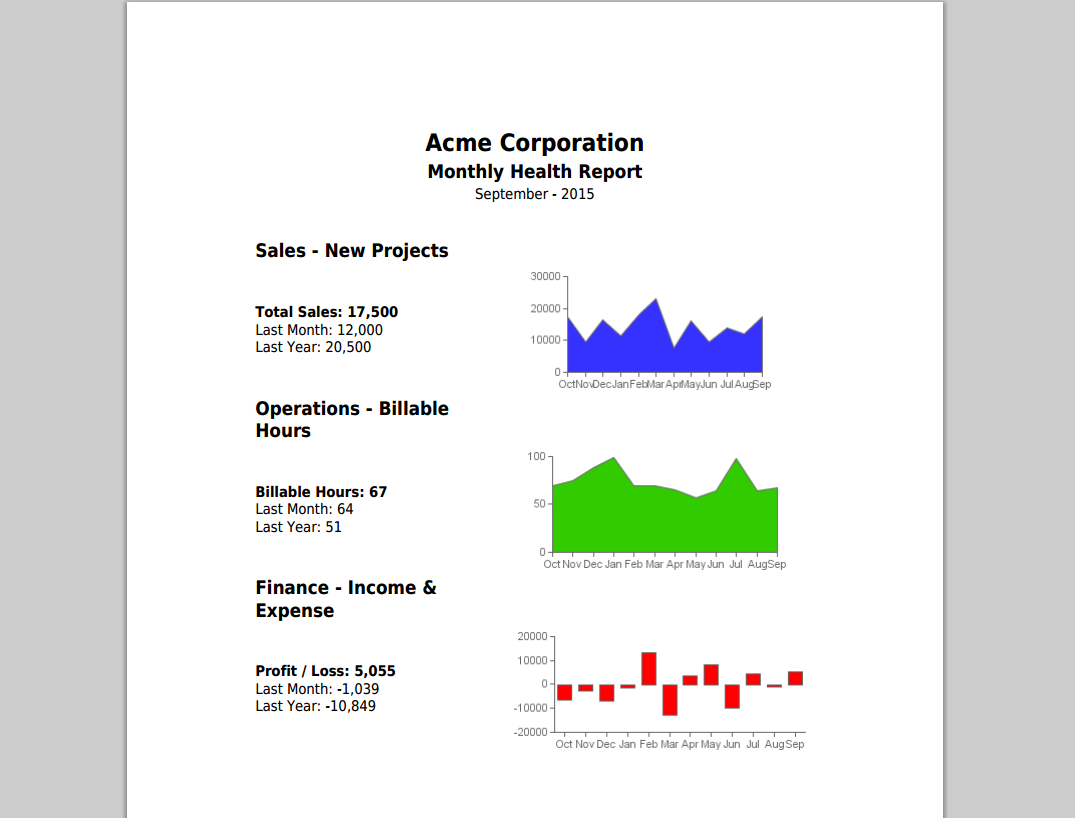
Here is an example of how we use GlobiFlow to generate our monthly corporate health reports. The resulting report is both emailed, and attached as a PDF:
I had written about this previously, but with the new image actions, this can be done with a lot less flows.
Overview
We use a Reports app to contain the detail numbers of each report, along with it's charts and final PDF report.
Once a month, we create a new Report in the Reports app, and enter the numbers for that period (this could be automated to some extent as well). The charts and text update as the numbers are changed. And when ready, we click the "Generate PDF" category option button to generate the PDF report and email to management.
The App Setup
The Reports App has the following input fields:
- Period (text for year and month)
- Dollars Sold New Projects (number)
- Total Billed Hours (number)
- Income Total P&L (number)
- Expenses Total P&L (number)
The app also has the following additional fields:
- Command (category button to initiate the PDF flow)
- Profit (calculation of Income - Expenses)
Finally, the Reports app also has these internal fields used by the flows:
- Sales Chart (image for graph of sales over 12 months)
- Sales Text (text for report)
- Billable Chart (image for graph of billable hours over 12 months)
- Billable Text (text for report)
- Profit Chart (image for graph of profit / loss over 12 months)
- Profit Text (text for report)
Shown in Podio:

The Chart Flows
We have 3 nearly identical flows that update text and charts as numbers are updated in the app items. Basically, they do the following:
- Get View of historical report items
- Calculate monthly amounts
- Update the Item with the new text and Chart
For example, here is the flow when the Sales number is changed:

The Chart action requires a comma-separated list of numbers, and that's what we're building in the running variable. To keep things simple, we use the same convention to get the sales number for last month and last year.
The labels variable is just a little bit of scripting to generate a comma-separated list of months to go along with the running variable data.
Back in Podio, when you now change the sales number in the report item:

GlobiFlow will automatically generate the text and chart and place it in Podio:

We have a very similar flow to update the billable hours text and chart:

And also to update the profit text and chart:

Notice that in the profit flow, we do not rely on the Podio calculation field for net profit, but instead re-calculate it using income-expenses. This is because the calculation field may not have updated in time and could provide an incorrect value. Just a little safety precaution.
In case you want to copy & paste as a starting point, here are the scripts in text:
running:
foo(); function foo() {
  $months = explode(",", [(Variable) running]);
  for ($i=0; $i<12; $i++) {
    $period = date("Ym", strtotime(substr([(Report) Period],0,4)."-".substr([(Report) Period],4,2)."-01" . " -".strval($i)." months"));
    if ($period == [(Ref Report) Period]) {
      $months[11-$i] = intval([(Ref Report) Dollars Sold - New Projects]);
    }
  }
  return implode(",", $months);
}
last:
foo(); function foo() {
  $last = explode(",", [(Variable) last]);
  $period1 = date("Ym", strtotime(substr([(Report) Period],0,4)."-".substr([(Report) Period],4,2)."-01" . " -1 months"));
  $period2 = date("Ym", strtotime(substr([(Report) Period],0,4)."-".substr([(Report) Period],4,2)."-01" . " -12 months"));
  if ($period1 == [(Ref Report) Period]) {
    $last[0] = intval([(Ref Report) Dollars Sold - New Projects]);

  }
  if ($period2 == [(Ref Report) Period]) {
    $last[1] = intval([(Ref Report) Dollars Sold - New Projects]);
  }
  return implode(",", $last);
}
labels:
foo(); function foo() {
  $labels = array();
  for ($i=11; $i>=0; $i--) {
    $labels[] = date("M", strtotime(substr([(Report) Period],0,4)."-".substr([(Report) Period],4,2)."-01" . " -".strval($i)." months"));
  }
  return implode(",", $labels);
}
NB: Don't forget to update the tokens in the scripts above if you're pasting this into a calculation field.
Generate the PDF
The last step is to generate the PDF. This flow triggers when the "Generate PDF" button is clicked and simply creates the PDF and also sends it via email:

The Result
The end result, is a simple method to generate monthly management reports. Simply create an item for the period (you can even have a flow auto-create these every month), fill in the numbers for the period, and click the Generate PDF category button.

You could even combine all 4 flows into one single flow to execute when the pdf button is clicked.
 by
Andreas Huttenrauch
by
Andreas HuttenrauchOwner of Globi Web Solutions, and Podio Fanatic.